Column: CATastrophe averted in Q3

The third quarter of 2023 was another painful experience for investors in traditional asset classes – in this column represented by S&P 500 and global government bonds – with both equities and bonds generating losses.
A widely used benchmark for a balanced portfolio consisting of 60% equities and 40% bonds lost 3.6%, with bonds driving the lion’s share of the loss. Being a bond bull is not easy at present. The yield of the US 10-year Government Bond, a widely monitored benchmark bond, gained 73 basis points in the third quarter, thus posting losses as the price of a bond falls when the yield goes up.
In my opinion, the bond bear market is getting surprisingly little attention.
Did you know that long-term bonds, in this case proxied by the iShares 20+ Year Treasury Bond ETF (ticker TLT), lost 51.7% of their value from when they peaked in August 2020 until they bottomed out in October? This is nearly the same magnitude as the losses equity investors experienced during the financial crisis when the S&P 500 dropped by 56.7%, and certainly not what many expected from their allegedly conservative diversifier in the portfolio.
But equity markets – and investors – are surprisingly relaxed. Sure, these extreme losses occurred on the long end of the curve and bonds with shorter duration experienced less severe drawdowns, but according to strategists at Bank of America, this bond sell-off is the worst since 1787!
Despite the rise in interest rates, many alternative asset classes have kept up quite well so far this year. Is this just volatility laundering, as some critics claim, or is this genuine performance? While some alternative asset classes are (at least to some degree) interest-rate sensitive, this is not the only factor relevant for valuations and in fact far from true for all. Some might even profit from higher base rates. I will add some more color to the debate in this column.
New benchmarks for this column
As mentioned in my last column, the infrastructure benchmark used was no longer being updated on Bloomberg, meaning i had to find a suitable replacement. We are currently working on a new benchmark provider and had hoped to be able to use that, not only for infrastructure but also for private equity buyout and venture capital, but the legal work is not finished yet. These indices consist of unlisted funds and are thus more representative for the results achieved by institutional investors. The disadvantage, however, is that these indices come with a lag, meaning that at this point in time only the Q2 results are available.When they become available, the figures will either be updated in this column or presented in a new one.
In addition to that, I had to replace the SG CTA index with the BarclayHedge CTA index as the former is no longer available on Bloomberg.
Before we dig into the numbers, I want to remind you of a few technical facts of importance.
- Most alternative investments, aside from liquid alternatives, are long-term investments. To evaluate the performance over a single quarter has limited explanatory power.
- There is always a time lag between reported returns and public market returns due to the illiquid nature of the underlying investments.
- The benchmarks chosen for Private Equity and Venture Capital are liquid replication benchmarks. Over longer timeframes, they have historically given a somewhat reliable picture of the asset classes; however, over a shorter horizon, they typically overstate the movements in the market (both up and down), according to my own analysis.
- Alternative investments are very heterogeneous in nature with huge dispersion on the manager level. The realized returns of an investor will most likely deviate from the benchmark level returns.
(The column continues below the table. Refresh page if table doesn’t show)
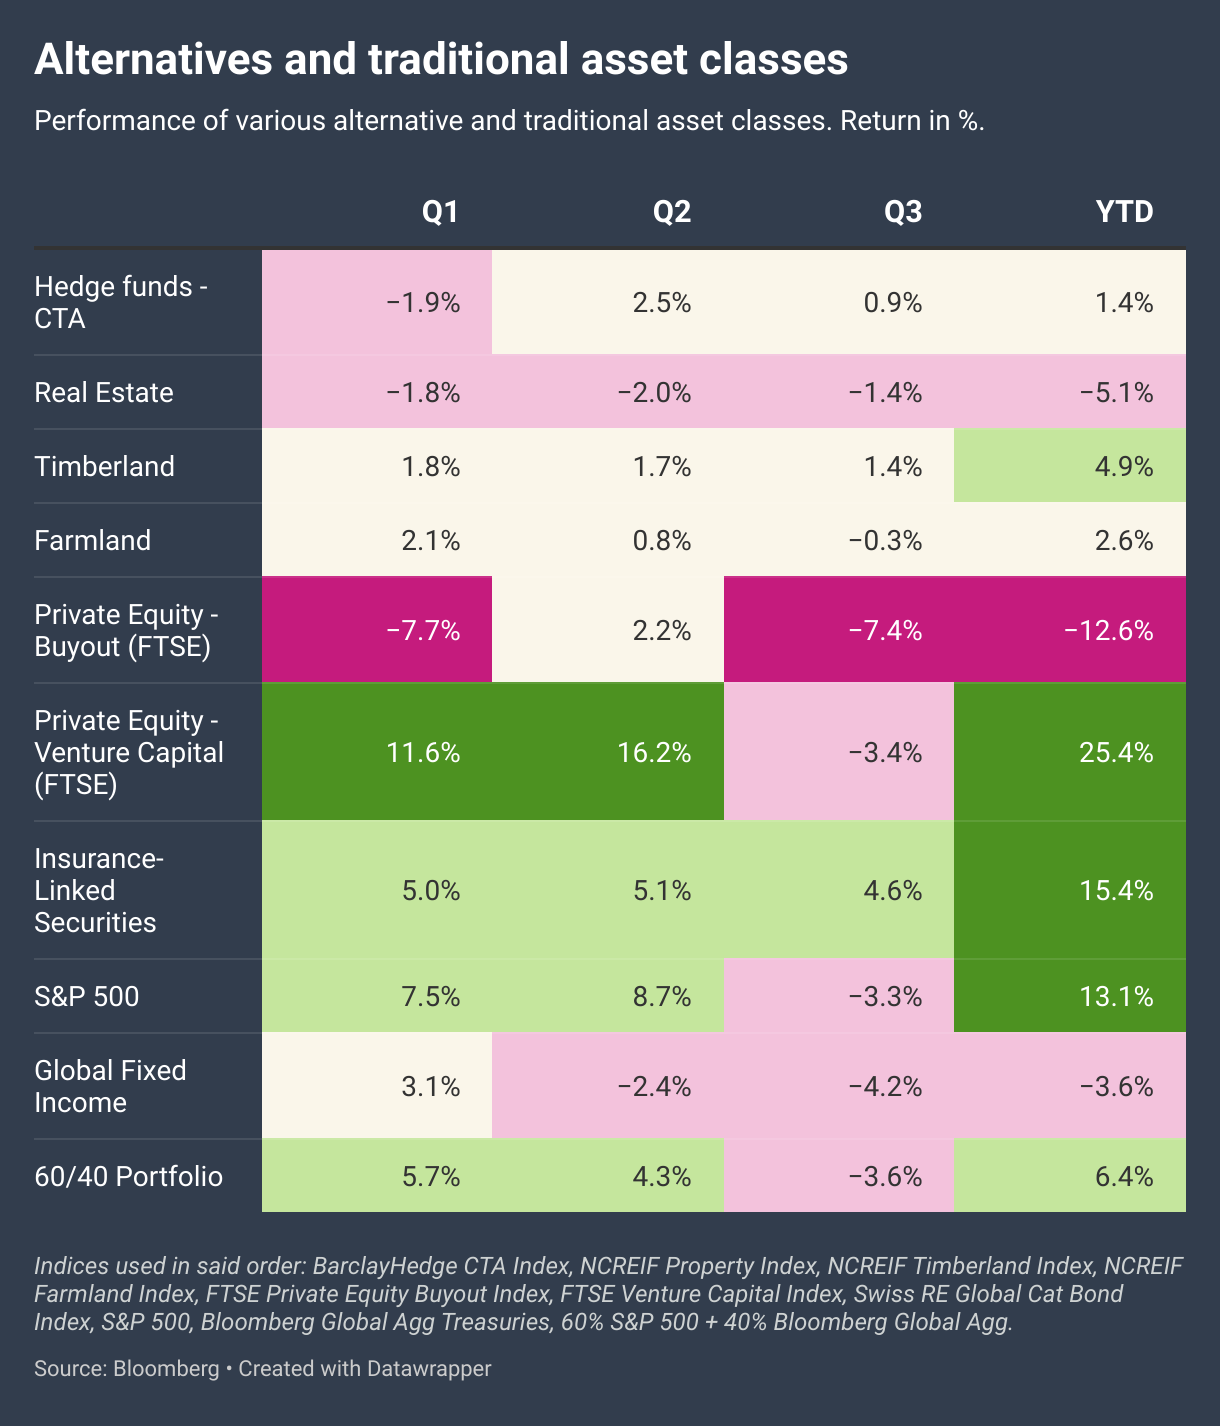
CTA, a sub-asset class from the hedge fund universe known for using trend-following models, continued the positive momentum from the second quarter and posted another positive quarter, ending the first nine months of 2023 with modest gains of 1.4%.
Commodity trends resumed in Q3 and added to the positive performance. In particular, long positions in oil and sugar and short positions in gold seem to have driven returns. Short positions in US fixed income were accretive due to the continued rise in interest rates, especially at the longer end of the curve. Finally, short positions in the Japanese Yen – one of the major performance drivers of 2022 – had a positive contribution again in Q3 2023.
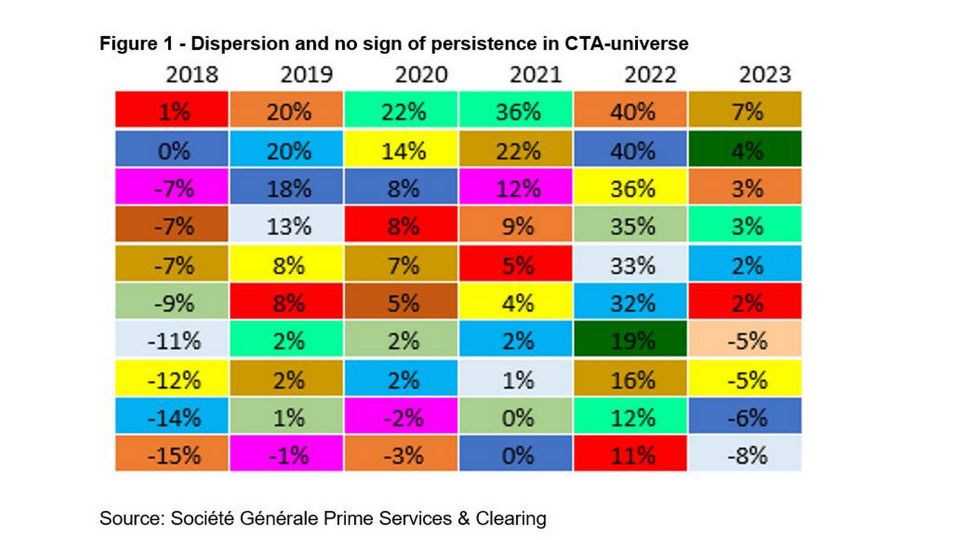
The dispersion on the manager level once again highlights the importance of diversification across several strategies. According to the November edition of the ”Nelson report” by Société Générale Prime Services, the difference in the year-to-date performance between the best and worst strategy is a staggering 98.6%.
Although manager selection is also important, figure 1 below shows that top performers in one year can easily be bottom performers the next – and vice versa.
CTA is one of the alternative asset classes profiting from a rise in interest rates – in fact, it is benefitting two-fold. Last year, there was a sustained trend of tackling rising rates by being short on bonds, and now, even from the high base rate, app. 80 – 85% of the money invested in CTA is in money market instruments due to the embedded leverage in futures. And this income increases the total return.
Infrastructure showed resilience during the first two quarters of the year, though as previously mentioned, we cannot include performance data in this column. The third quarter will be interesting as this is when the stock price of renewable energy darling Ørsted came under pressure after the company announced impairments due to challenging market conditions. This relates to development projects of offshore wind parks that are negatively impacted by supply-chain issues, increased interest rates, and lack of favorable progress in Investment Tax Credit (ITC) guidance. The Ørsted case even led the Danish FSA to start an extraordinary inspection of (some) Danish pension funds’ valuation of wind assets.
Even though the Ørsted case has gotten a lot of attention, it is important to take a nuanced view of the infrastructure asset class as airports, for example, are performing very well as both vacation and business travel are rebounding after Covid-19 lockdowns. This is also the case when looking at the stock prices of the listed airport groups.
Even the renewable energy sector is not all the same. The offshore wind case is all about assets in the construction phase, where the income inside was secured at fixed prices through CfDs and PPAs while the construction costs were variable, leading to a discrepancy between the revenue and cost side now that construction prices have skyrocketed.
Existing wind assets are not necessarily having the same problems. But some are, and this is the case for one of the largest onshore wind parks in Sweden, which seems to be in trouble due to unfavourable offtake agreements. But here again, the devil is in the details, and the highly heterogeneous nature of this asset class makes it hard to come up with some general statements regarding the state of the industry.
Real Estate, represented by the NCREIF Property Index, an unleveraged index of directly held properties in the US, continued downwards and ended the quarter with a loss of 1.37%. Office, making up 23% of the index, was – once again - the laggard with a loss of 3.67%. Hotels were the only sub-asset class with positive returns of +1.88%, while retail and industrial were nearly flat with minor losses of -0.12% and -0.26%, respectively. Both hotels and retail were hit hard by the Covid crisis and are now recovering from low levels, being the only two sub-asset classes with positive returns year to date. Hotels are up by 8.37%, and retail by a modest 0.22%.
Offices are going through hard times now, with some rather spectacular discounts – when transactions do happen at all. IPE reported that an office tower in San Francisco recently transacted at a price that is 45% lower than when it traded last time in 2020. Another example is the acquisition of an office building in Chicago, bought for USD 45m, a whopping USD 77m discount on the price the seller paid in 2014 and about 50% below the approximately USD 88m refinancing loan the seller took out in November 2019. The recent bankruptcy of WeWork has not improved the short-term outlook.
Timberland continued to show resilience and posted positive returns of 1.37% in the third quarter, while farmland declined by -0.26%. The positive year-to-date performance of these two real asset categories might seem counterintuitive against the backdrop of rising interest rates. But is it?
Some listed timber REITs also posted positive returns in the first nine months of the year (Acadian, PotlatchDeltic & Weyerhaeuser), so at least in the timber sector, this is not exclusively in the unlisted space. There are also research papers from both Manulife and Nuveen showing that it is not unusual, in a historical context, that timberland and farmland show resilience in a rising rate environment. Other factors, like demand from the building sector, commodity prices and of course the debt-to-equity ratio, also influence the impact of rising rates.
Private Equity suffered in Q3, with both Buyouts and Venture Capital down according to the liquid replication benchmarks used in this column.
However, it is worth remembering that this comes after the fabulous first half of 2023 for (liquid) Venture Capital. When looking at the ”real” PE & VC indices during the first half of the year, things are more dampened, where both are up but VC much less than the liquid version. The numbers for Q3 are unfortunately not out yet due to their illiquid nature.
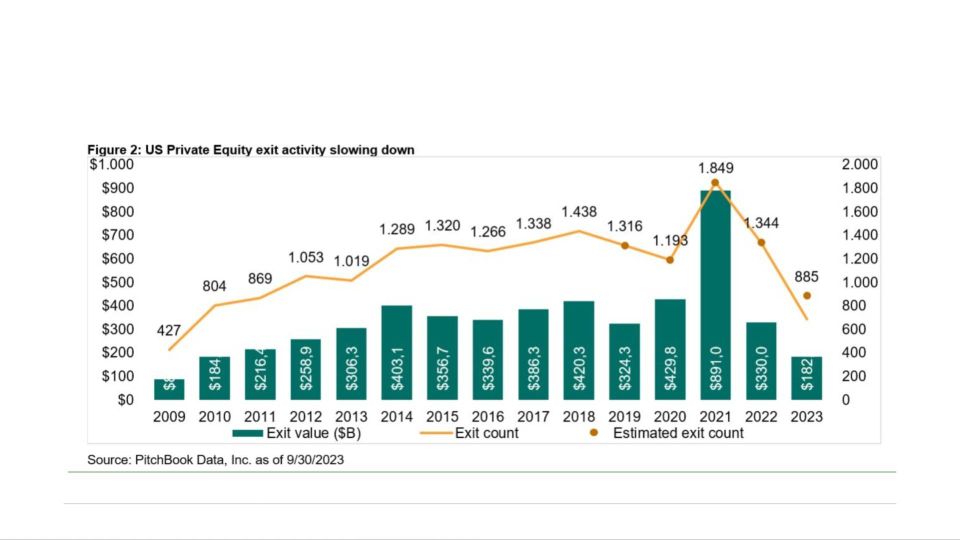
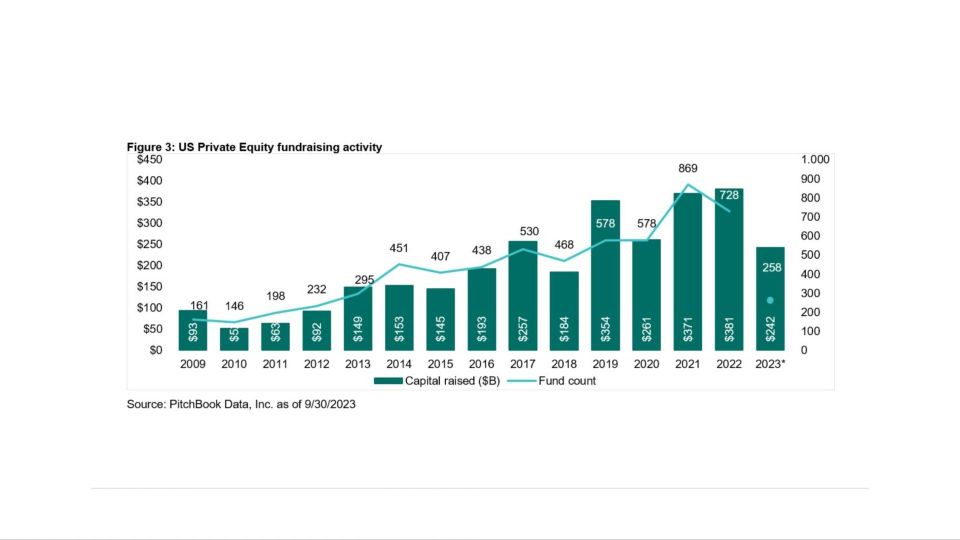
But things are not exactly rosy in private equity land. Exit and fundraising activities are down, as shown in Figures 2 and 3 below. Compared to the record year of 2021, it looks dramatic, less so if compared to the other years, but still, it is something worth noting. The fund-raising market in 2023 is also a tale of two markets and the year of large funds. While the funds raising more than USD 1bn in the prior years accounted for around 10% of total fundraising volume, they stand now for more than 20%. In contrast, the smaller funds with under USD 100m under management now account for 37%, down from approximately 50% historically, according to Pitchbook data.
Valuations have stayed relatively stable in 2023 – not only on book values but also in transactions. According to Pitchbook data, buyout purchase prices throughout the first three quarters of 2023 were 11.5x EBITDA, down only slightly from the peak of 11.8x in 2022. This is, of course, positive for investors currently holding private equity as they don’t have to mark down their assets, but makes the outlook for private equity returns somewhat bleak.
The higher interest rates might have had a smaller impact so far than feared, both due to still sound topline growth but also due to a larger share of equity injected in the transactions. While equity contributions typically were around 30% prior to the GFC, they account now for more than 50%, according to Pitchbook data.
With private credit profiting from the rising interest rates and now paying double-digit coupons, private equity seems less attractive at the moment.
Does that mean that investors should stop giving new commitments to private equity? No.
Academic research has shown that trying to time your commitments only achieves, at best, modest gains. These have to be weighed against organizational costs and frictions that allocation swings may pose for maintaining a long-term capability in private equity investing. Commitments given today will be drawn over the course of the next 4 - 5 years at the discretion of the GP anyway. But being even more selective when it comes to who you invest with and not re-upping to non-core relations sounds like a feasible way forward to me. So, I would stick to the long-term plan and keep committing to core relations. However, now may not be the right time to increase allocations to private equity, given the relative attractiveness of private credit at the moment.
That said: if you find timing hard in the listed markets, you haven’t tried it in the unlisted.
Insurance-Linked Securities (ILS), often also referred to as ”CAT Bonds” (catastrophe bonds), continued their strong performance and posted 4.6% growth on the Swiss Re Global CAT Bonds Index, bringing the total return during the first nine months of the year to 15.4% - one of the strongest performances among the alternative asset classes covered in this column and the strongest year since the inception of the index. This is driven by both higher spreads (e.g., insurance premiums), higher rates on the collateral and a rebound of some CAT bonds that traded down in the aftermath of Hurricane Ian in late 2022 that were not as affected as initially thought – and, of course, no major catastrophe.
As the collateral is typically invested in floating rate notes with very low duration, this asset class is another one that, in fact, profits from rising rates as the higher rates increase the total return of the CAT bonds.
The good performance continued into Q4, and as of the time of writing, the total return year-to-date stands at 18.2%. The hurricane season is over (it runs from June 1st to November 30th), so chances are pretty good, that this year will end up as being the best year in history for investors in this asset class.
Conclusions
Broadly, alternative investments have justified their place in a multi-asset portfolio by providing the diversification that bonds did not offer in Q3 (and 2022, for that matter). But it is worth mentioning again that alternatives are very heterogeneous in nature, as both the recent performance and the outlook differ substantially between the various alternative asset classes, including on asset level. This is not least because the rise in interest rates hit very differently. ILS & CTA and private debt are all profiting due to the floating rate nature of the collateral or the contract itself, while interest rates play a role in the pricing of real assets and private equity. But rates are only one side of the story; the equity risk premium is the other part of the discount rate, and the income stream is not static, either. A rise in revenues can more than offset a rise in interest rates.
With hurricane season over, ILS is on course for the best year since inception of the index more than 20 years ago and might even end up as the best-performing alternative asset class overall.
CTA had a rough start to the year, where some sharp reversals in interest rates following the banking crisis in March brought the high-flying asset class from 2022 crashing to the ground. But the strategies still have the potential to provide crisis alpha, especially if things turn really sour in 2024 with extended downward moves. The odds of positive returns have increased with the rise in interest rates.
Private equity has been somewhat stable so far this year, but trouble is brewing due to higher rates. Should topline growth in portfolio companies turn negative, interest coverage ratios could drop further and finally lead to bankruptcies. With private credit now paying double digits coupons, it becomes harder to argue for investing in the equity when you can get an equity cushion in front of you and still get equity-like returns by taking the debt instead. But timing is hard, so it is often the best strategy to keep a somewhat stable commitment pace.
Commercial real estate, and especially offices in the US, might be getting into hot water with more rumors of rather spectacular discounts offered by sellers in the US market.
Infrastructure is a very diverse asset class with both positive and negative characteristics. It will be interesting to follow the development in the wind energy space over the course of the next months.
Stay tuned for the Q4 update which will be published in February 2024.
Disclaimer:
This column is provided for informational purposes only and such information is not intended to be relied upon as a forecast, research or investment advice. Velliv, Pension & Livsforsikring A/S makes no guarantee, representation or warranty and accepts no responsibility or liability as to its accuracy and completeness. Neither the information nor any opinion expressed herein constitutes a recommendation, offer or solicitation to buy or sell any securities or to adopt any investment strategy. Such information and opinions are subject to change without notice. Past performance is no guarantee of future results.
Christoph Junge is Head of Alternative Investments at Velliv, Denmark’s third-largest commercial pension company. He is a Chartered Alternative Investment Analyst with more than 20 years of experience in the financial industry in Denmark and Germany. He has worked with Asset Allocation, Manager Selection, as well as investment advice in, among others, Nordea, Tryg and Jyske Bank.
Besides working as a Head of Alternatives, Christoph teaches a top-rated course on Alternative Investments. Read more at http://www.christoph-junge.de
Related articles
Analysis: The new challenges for the private equity club
For subscribers